Vous suivez les perfs de vos pages, vous avez entendu parler des Core Web Vitals, mais entre tous les outils disponibles, pas simple de savoir où cliquer, quoi regarder, ni à quel moment. Pas de panique, on fait le tri ensemble.
Ce qu’il faut retenir :
- LCP, INP et CLS mesurent vitesse, réactivité et stabilité d’une page.
- Google utilise les données réelles de CrUX pour évaluer les sites.
- 13 outils pour mesurer et suivre vos Core Web Vitals.
Qu’est-ce que les Core Web Vitals
Pendant des années, on a mesuré la performance web avec des indicateurs comme le TTFB ou le nombre de requêtes JavaScript. Mais avec l’arrivée d’HTTP/2, la montée en puissance des frameworks front et l’évolution des navigateurs, ces métriques ont perdu de leur pertinence. Ce n’est plus seulement une question de vitesse brute, mais de ressenti utilisateur.
C’est pour ça que Google a introduit les Core Web Vitals : trois indicateurs qui traduisent de manière concrète ce que perçoit un utilisateur quand il navigue sur une page. Est-ce que ça charge vite ? Est-ce que c’est stable ? Est-ce que ça répond bien quand on clique ?
Voici les trois métriques principales :
- INP (Interaction to Next Paint) : depuis mars 2024, l’INP a remplacé le FID. Il mesure le délai entre une interaction utilisateur (clic, tap) et le moment où le site affiche une réponse visuelle. C’est un signal fort de réactivité.
- LCP (Largest Contentful Paint) : il mesure le moment où le plus gros élément visible de la page (souvent une image ou un titre) s’affiche complètement dans la fenêtre. Un bon LCP dépend souvent du template, de l’appareil ou même d’un détail comme une pop-up de consentement.
- CLS (Cumulative Layout Shift) : cet indicateur évalue la stabilité visuelle. Il détecte les décalages inattendus pendant toute la durée de vie de la page, pas seulement au chargement. Typiquement, un bouton qui bouge au moment où on allait cliquer dessus.
CrUX : les vrais chiffres, depuis les vrais utilisateurs
Ce qu’un outil de performance vous affiche en local ne reflète pas forcément l’expérience de vos visiteurs. Ce sont des tests en labo, dans un environnement standard. Mais Google, lui, regarde autre chose : les données réelles, issues du terrain. Et c’est là que CrUX entre en jeu.
CrUX, pour Chrome User Experience Report, c’est une base de données publique alimentée par les utilisateurs du navigateur Chrome. Elle collecte des métriques de performance réelles, dans les conditions de navigation du quotidien : un smartphone classique, une 4G pas toujours stable, des onglets ouverts en arrière-plan, etc..
Ces données sont dites “field”, par opposition aux données “lab”, générées localement avec des outils comme Lighthouse. Les données CrUX sont celles que Google utilise pour juger de vos Core Web Vitals dans son algorithme. Autrement dit, un bon score PageSpeed ne garantit rien si les données CrUX, elles, sont mauvaises. Ce sont ces dernières qui pèsent réellement.
Vous pouvez consulter ces données :
- Via PageSpeed Insights, si votre URL reçoit assez de trafic
- Dans Search Console, avec le rapport dédié aux “Signaux Web essentiels”
- Ou de façon plus avancée via l’API CrUX ou BigQuery, si vous avez besoin de faire des analyses à grande échelle
À noter que CrUX ne couvre pas toutes les pages. Il faut un certain volume de trafic pour qu’une URL remonte dans la base. Pour les sites récents, peu visités ou très niche, certaines pages ne seront tout simplement pas mesurées. Mais à l’échelle d’un site établi, c’est un excellent reflet de l’expérience utilisateur réelle.
11 outils pour mesurer et suivre vos Core Web Vitals
Il existe de nombreux outils pour mesurer les Core Web Vitals, mais tous ne servent pas le même objectif. Certains sont utiles pour des audits ponctuels, d’autres pour du suivi continu, et quelques-uns sont pensés pour une intégration technique plus poussée. Ce tableau vous aide à y voir plus clair, selon votre besoin et votre niveau.
| Outil | Usage principal | Niveau technique | Prix |
|---|---|---|---|
| PageSpeed Insights | Audit ponctuel (SEO/perf) | Faible | Gratuit |
| Lighthouse | Audit technique local | Moyen | Gratuit |
| Chrome DevTools | Analyse détaillée front | Avancé | Gratuit |
| Search Console | Suivi global site | Faible | Gratuit |
| WebPageTest | Test en conditions réelles | Moyen | Freemium |
| Speetals | Suivi SEO multi-sites | Faible | À partir de 29€/mois |
| Treo.sh | Monitoring simple CrUX | Faible | À partir de 100€/mois |
| DebugBear | Monitoring technique continu | Avancé | À partir de 99€/mois |
| PageRadar | Suivi visuel + alertes | Moyen | À partir de 29€/mois |
| Datadog | Monitoring prod DevOps | Avancé | Freemium |
| RUMvision (CWV Compare Competitors) | Audit de concurrence | Avancé | À partir de 100€/mois |
4 outils recommandés par un expert de la Webperf
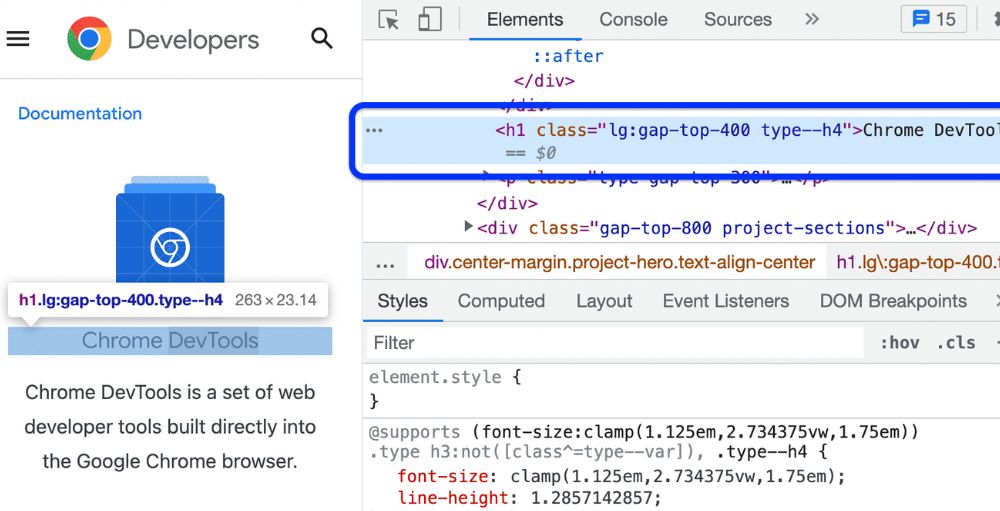
Chrome DevTools
Incontournable pour visualiser ce que l’utilisateur voit vraiment et comprendre pourquoi une page se comporte mal. Parfait pour analyser un LCP ou un CLS à la volée.

Chrome DevTools est un outil idéal pour déboguer les Core Web Vitals en mode laboratoire grâce à l’onglet “Performance”.
Il permet d’analyser les données potentielles qui pourraient être envoyées à BigQuery pour alimenter le Chrome UX Report. En plus d’identifier précisément l’élément LCP , c’est également l’un des meilleurs outils pour diagnostiquer en direct les KPI mesurés tout au long du cycle de vie de la page, tels que le CLS et l’INP.Aymeric Bouillat
Treo.sh
Idéal pour suivre l’évolution des Core Web Vitals réels dans le temps, avec une interface claire, sans se perdre dans un dashboard technique.
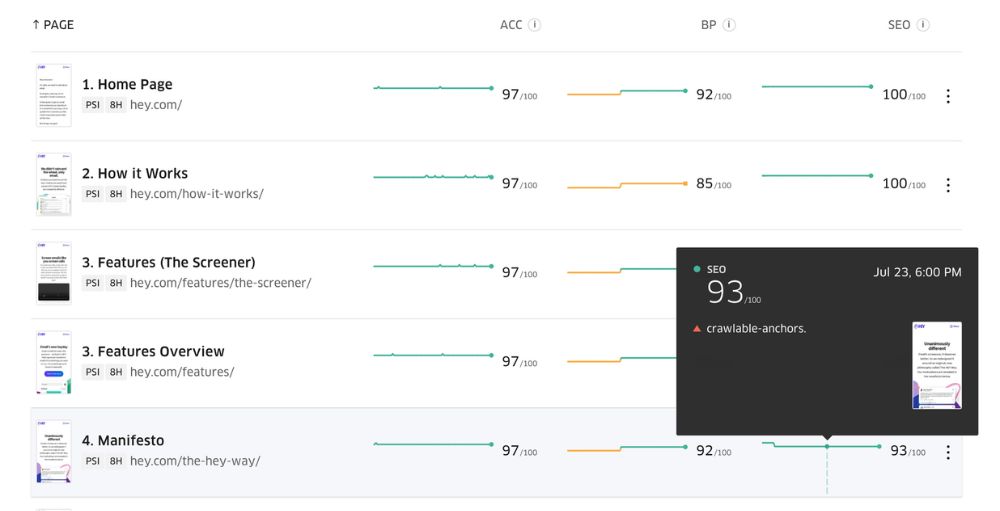
Treo.sh offre l’avantage de permettre une identification rapide des templates les plus impactés par de mauvais scores Core Web Vitals, facilitant ainsi la priorisation des actions pour chaque KPI. Sa véritable force réside dans sa détection dynamique des URLs avec des données d’un domaine particulier.
Aymeric Bouillat

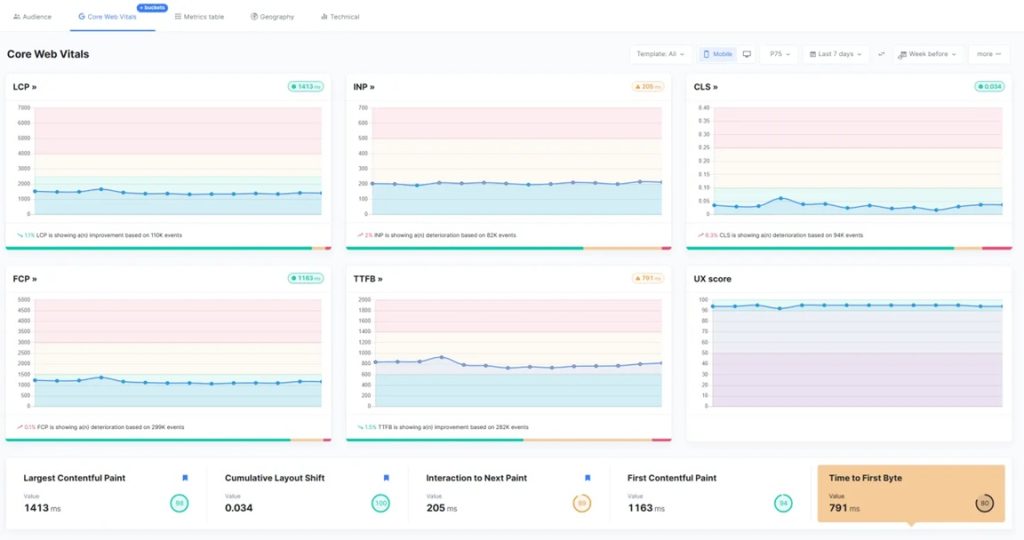
DebugBear
Parfait pour monitorer en continu, repérer des régressions et intégrer les performances dans un workflow produit ou CI/CD.
DebugBear qui permet de suivre à la fois des données Crux mais aussi de laboratoire via l’API PageSpeedInsights, est idéal pour suivre les progression de KPI Webperf en fonction des améliorations techniques apportées à un site. Il offre aussi des recommandations poussées pour favoriser le chargement des ressources critiques au dessus de la ligne de flottaison dans la vision “Waterfall” (chargement des fichiers en cascade)
Aymeric Bouillat
RUMvision (CWV compare competitors)
Mesurez, analysez et améliorez la vitesse de votre site et vos indicateurs Web essentiels grâce aux données visiteurs en temps réel.
Savoir que son site semble rapide et proposer une bonne expérience utilisateur, c’est bien, mais savoir comment on se situe par rapport à la concurrence c’est encore mieux. C’est ce que CWV compare competitors permet afin de savoir comment le site se positionne par rapport à des sites du même secteur préalablement identifiés. Idéal dans le cadre des audits Web perf
Aymeric Bouillat
Merci à Aymerci Bouillat pour ses retours d’expérience et ses conseils 
Les outils, c’est bien. Les utilisateurs, c’est mieux.
Les bons indicateurs ne sont pas là pour vous stresser, mais pour vous guider. Le vrai enjeu, ce n’est pas d’avoir 100/100 sur Lighthouse, mais de comprendre comment vos utilisateurs vivent votre site, chaque jour, sur leurs propres appareils.
Les Core Web Vitals vous donnent des repères concrets pour identifier ce qui gêne vraiment l’expérience. Pas besoin de tout mesurer, ni de suivre dix dashboards : concentrez-vous sur les pages qui comptent, avec des outils que vous maîtrisez. Un bon point de départ, c’est déjà une grande partie du chemin.
L’article “Core Web Vitals : Vous pensez que votre site est rapide ? Google n’est pas forcément d’accord” a été publié sur le site Abondance.