Lorsque l’on se lance en e-commerce, que ce soit en tant que pure player ou que business “physique” s’adaptant aux tendances digitales actuelles, il est nécessaire de prendre du recul sur son activité afin d’observer, d’analyser et al fine de comprendre ce qui s’y passe.
Là où certains magasins physiques se fiaient essentiellement à la fréquentation, au chiffre d’affaires généré ou au nombre de clients, l’e-commerce a ouvert les portes de l’analyse fine et de la compréhension de ses résultats grâce à des outils relativement simples à appréhender.
Nous avons répertorié plusieurs métriques, KPIs et statistiques afin de booster les ventes de votre e-commerce. Découvrons-les dès maintenant !
7 statistiques éclairantes sur le e-commerce
Pour se démarquer, booster son taux de conversion et augmenter ses ventes, il existe de nombreux outils et ressources très utiles. Mais il est aussi parfois nécessaire de prendre du recul et d’observer les chiffres pour obtenir une vue d’ensemble du secteur. On est ainsi plus apte à prendre des décisions éclairées pour son site de e-commerce.
1. Les sources de trafic des sites de e-commerce
L’une des variables essentielles pour un site de e-commerce est la provenance de son trafic. Il est primordial de savoir d’où viennent vos visiteurs et la manière grâce à laquelle ils trouvent votre site.
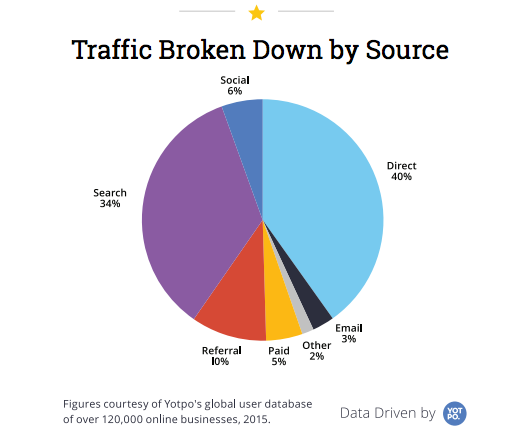
Comme le montre ce graphique, le trafic direct représente 40 % des visites des sites d’e-commerce. Ce canal donne à voir essentiellement les clients fidèles qui ont ajouté le site en favori ou l’ont tapé directement dans la barre de recherches de leur navigateur.
Les autres sources de trafic sont donc plus intéressantes. Le référencement naturel pèse pour 34 % des visites, loin devant les sites référents (10 %) ou les réseaux sociaux (6 %).
2. Les canaux qui génèrent le plus d’achats en e-commerce
S’il est crucial de connaître la provenance des visiteurs de son site e-commerce, il est encore plus important de déterminer les sources de trafic qui génèrent le plus d’achats (conversions). En effet, cela vous permet d’affiner votre stratégie web marketing et de focaliser vos efforts sur les canaux les plus performants.
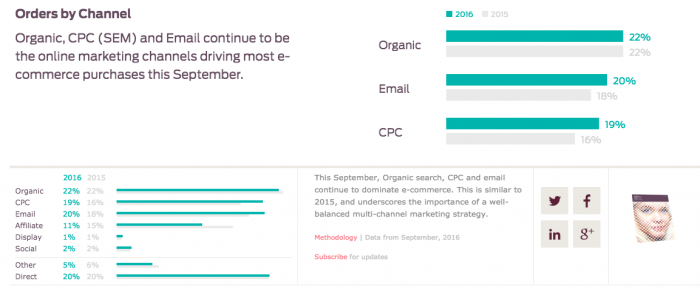
Ces chiffres signés Custora sont représentatifs : le référencement naturel est à l’origine de 22 % des achats en ligne (en 2016). Il est suivi de près par l’emailing, qui est donc loin d’être dépassé (20 %) et par le référencement payant (19 %).
3. Le poids du e-commerce ne cesse d’augmenter
Dans une société hyperconnectée, le e-commerce n’a pas pour autant remplacé la vente traditionnelle en magasin. Cependant, son évolution progressive est à même d’illustrer l’importance que le e-commerce a prise ces dernières années.
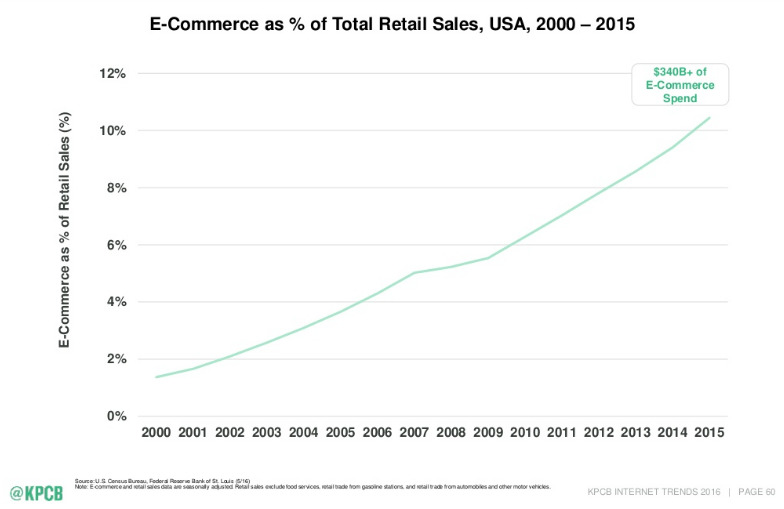
Comme l’indique cette étude, le e-commerce ne pesait en 2015 “que” 10 % du total des ventes au détail. Mais il y a des raisons de penser que le e-commerce a encore du potentiel. En témoigne son évolution rapide, passant de 4 % en 2005 à 10 % dix ans plus tard. Et ces chiffres ne cessent d’augmenter ! Le commerce en ligne attire de plus en plus les nouvelles générations d’internautes, s’imposant ainsi comme un secteur d’avenir.
4. Les réseaux sociaux et le e-commerce
Bien qu’ils ne constituent pas le canal apportant le plus de visites ou de conversions, les réseaux sociaux restent pour les internautes un moyen privilégié de dénicher de nouveaux produits.
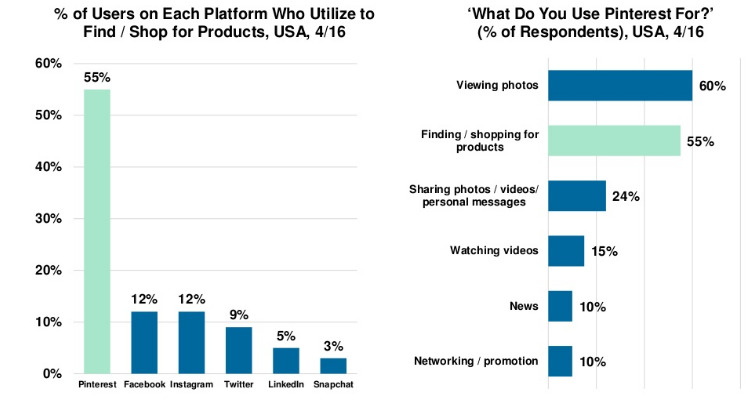
À ce niveau-là, Pinterest tire clairement son épingle du jeu. En effet, 55 % de ses utilisateurs déclarent s’en servir pour trouver et acheter des produits. Ses deux dauphins, Facebook et Instagram, sont largement distancés, avec 12 % seulement. C’est une raison supplémentaire pour doper votre visibilité sur ce réseau social.
5. Le poids du mobile en e-commerce
La navigation sur mobile a véritablement explosé au cours des dernières années, et le e-commerce n’échappe pas à ce phénomène.
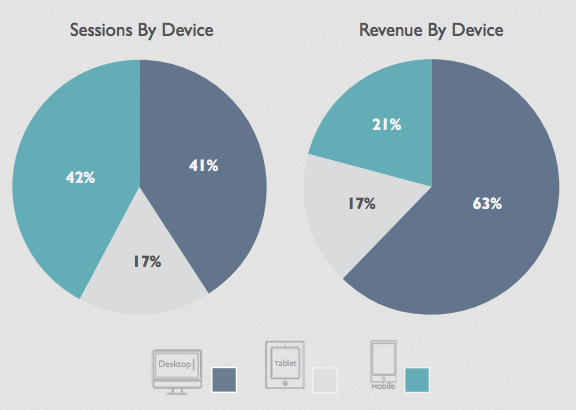
D’après cette étude, le support mobile représente 42 % du trafic des e-commerçants, talonné par les ordinateurs de bureau (41 %).
Toutefois, lorsque l’on s’intéresse au chiffre d’affaires par support, la part du mobile recule à 21 % (le desktop raflant la mise avec 63 %).
Ainsi, le mobile est devenu un support incontournable pour les e-commerçants, puisque c’est celui qui génère le plus de visites. Toutefois, l’ordinateur reste le moyen privilégié par les internautes pour effectuer leurs achats.
6. La livraison en e-commerce
La livraison est un point crucial pour n’importe quelle boutique en ligne, et c’est d’ailleurs l’une des principales raisons pour lesquels les clients abandonnent leur panier. Bien comprendre les attentes des internautes en matière de livraison est donc essentiel.
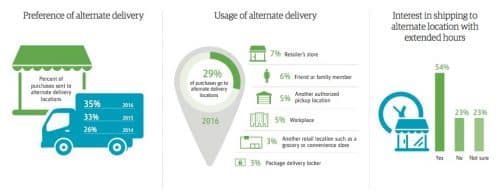
Ces chiffres mettent en lumière la préférence grandissante des consommateurs pour les lieux de livraison alternatifs :
- Magasin ;
- Ami ou membre de la famille ;
- Point relais ;
- Lieu de travail ;
- Casier…
En 2016, 35 % des produits achetés sur internet ont été livrés dans ces lieux alternatifs.
7. La place des marketplaces dans le e-commerce
Nous l’avons vu plus haut, le SEO apporte une part importante du trafic des e-commerçants.
Toutefois, ce n’est pas toujours sur les moteurs de recherche que les internautes commencent à chasser de nouveaux produits…
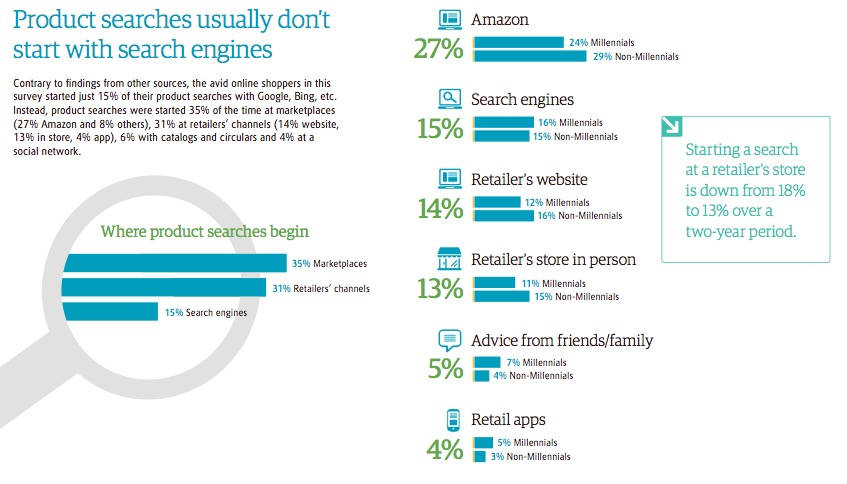
Comme l’indiquent les chiffres ci-dessus, la recherche de produits commence, dans 35 % des cas, sur des marketplaces, avec Amazon en tête de liste. Cela confirme l’importance pour les e-commerçants d’être bien référencé sur Amazon et sur les autres places de marché.
Avant toute observation de KPIs, fixez-vous des objectifs !
De prime abord, cela peut paraître évident. Dans tout business, on se fixe des objectifs à atteindre, ce qui permet de valider une bonne semaine, une bonne année ou un bon exercice.
Attention : Là où il ne faut pas confondre les objectifs business avec les objectifs analytics, c’est que ces objectifs analytics peuvent permettre de conditionner la performance future de l’entreprise.
Qu’il s’agisse de mieux comprendre son site web pour l’améliorer par la suite, de mieux cerner le comportement de ses acheteurs potentiels ou l’évolution de ses campagnes de communication, il est crucial de se fixer des objectifs “d’apprentissage” pour que l’analyse statistique ne se résume pas à des chiffres indiquant l’évolution du business.
Grâce à ces objectifs, il est ainsi possible de passer au-delà des chiffres et de se servir de son “tracking” quotidien pour faire évoluer sa communication, la structure de son site web ou de ses offres.
Quelles sont les KPIs à observer sur mon site web e-commerce ?
Pour guider l’observation et simplifier l’analyse de son site web, nous avons choisi de présenter 5 KPIs clés d’un site e-commerce, qui permettent de comprendre l’évolution de son activité et de ses performances.
1. Le taux de rebond
Au-delà des indicateurs traditionnels qu’il est possible d’observer sur un site web (trafic, chiffre d’affaires généré, nombre de pages vues, etc), le taux de rebond va permettre d’observer le comportement des visiteurs qui arrivent sur le site.
Exprimé en pourcentage, le taux de rebond définit le nombre de visiteurs qui quittent le site web après n’avoir vu qu’une seule page. Plus ce pourcentage est bas, moins de personnes quittent le site web sans aller sur une seconde page, et par conséquent, sans s’intéresser davantage au contenu du site.
Le taux de rebond est un indicateur de qualité aux yeux de Google et aux yeux des analystes. En effet, lorsqu’il est extrêmement élevé (80% ou plus), il peut indiquer l’existence d’un site spam qui ne correspond pas du tout à sa description ou à la publicité qui en est faite.
En surveillant ce taux, il sera possible de juger de la qualité des pages d’entrée de vos visiteurs (home page, page d’offre). Vous pourrez ainsi ajuster le discours, la structure ou la communication qui mènent à celles-ci afin d’être au plus transparent avec les internautes et leur éviter d’arriver sur un site web dont le contenu ne les intéresse pas.
Une variation importante de ce taux de rebond sur une période donnée peut notamment indiquer un bug sur le site web ou un problème de ciblage d’une campagne de communication.
2. Le taux de conversion (ou de transformation)
Le taux de conversion est l’un des KPIs essentiels en e-commerce. Là où vous avez un nombre de visiteurs (ou de pages vues) et un chiffre d’affaires généré sur le site web, il est possible d’obtenir un taux de conversion définissant la capacité à transformer un visiteur en prospect (s’il donne des informations à l’entreprise) ou en client (s’il achète une prestation ou un produit).
L’objectif est de maintenir ou d’améliorer ce pourcentage au plus haut.
À titre d’exemple, un taux de conversion de 5% indique que 5 visiteurs sur 100 ont acheté un produit sur le site e-commerce. Cette information permet par la suite d’estimer son potentiel pour les prochains mois et d’observer l’impact des campagnes marketing sur l’évolution de ce taux.
Cet indicateur est extrêmement intéressant mais se doit d’être corrélé à un autre : le panier moyen.
À lire aussi : E-commerce : 4 stratégies marketing à mettre en place pour doper vos ventes
3. Le panier moyen
Indiquant le chiffre d’affaires généré en moyenne par un acheteur sur le site, le panier moyen permet de se rendre compte de la valeur associée à un client.
Cet indicateur doit être relié au taux de conversion. En effet, il indique la performance de l’entreprise de façon plus globale que s’il en était dissocié. Par exemple, en période de soldes, le taux de conversion pourra doubler, voire tripler, là où le panier moyen sera en baisse à cause des réductions alléchantes proposées sur les prix.
De fait, les évolutions doivent être considérées ensemble car certaines conclusions non pertinentes pourraient être tirées sans une vision ajustée sur les chiffres. L’un des objectifs qui peut se fixer est alors d’augmenter le panier moyen de ses clients. Comment ? En leur proposant par exemple des ventes associées, qui permettent d’augmenter le chiffre d’affaires généré sans aller chercher de clients supplémentaires.
4. Le taux d’abandon de panier
Si l’on observe le taux de conversion, alors il faut observer le taux d’abandon de panier.
Les géants du e-commerce l’ont bien compris. Le tunnel de conversion est l’un des plus gros enjeux du site web. En effet, il est constitué de la phase critique de mise en panier, de création de compte et du rapport au prix final qu’il va falloir débourser pour passer sa commande.
Durant cette phase, de nombreux facteurs peuvent impacter négativement l’internaute et lui donner plus de raisons d’abandonner son panier que de passer sa commande.
Nous pourrions citer, entre autres :
- Un site web lent ;
- Un tunnel de conversion pas assez clair ;
- Des difficultés à entrer ses informations de paiement ;
- Un manque de réassurance sur la livraison ou sur la confidentialité bancaire, etc.
Les raisons sont nombreuses pour abandonner un panier. Et ce pourcentage doit être au cœur de l’analyse de la performance du site e-commerce. En effet, le site web peut être extrêmement performant jusqu’à la phase finale. Mais rebuter 70% de personnes prêtes à passer commande implique de comprendre, grâce aux pages de sortie et à une étude comportementale sur son tunnel d’achat, quelles sont les raisons qui provoquent ce désistement.
5. Le coût d’acquisition d’un client
Sortons un petit peu de l’analytics pur et cherchons davantage à comprendre la façon dont les internautes viennent sur le site web pour commander.
Ce qui peut être intéressant ici, c’est de s’intéresser directement à l’internaute, aux offres et à la publicité qui sont mises en place pour l’attirer. En associant les dépenses budgétaires aux offres en place, par rapport au nombre d’acheteurs sur le site, il est possible d’obtenir le coût d’acquisition pour un client. Cela permet d’observer la rentabilité des actions entreprises pour ne conserver que celles qui sont efficaces.
Attention : S’il est plus élevé que le panier moyen, le coût d’acquisition indique une performance négative. Cela ne concerne pas les stratégies d’entreprise caractérisées par une conquête agressive pour gagner en parts de marché.
Cet indicateur peut ainsi permettre diverses interprétations et analyses, en fonction des objectifs business et de l’évolution du marché.
Conclusion
Vous l’aurez compris, il existe une multitude de KPIs permettant d’observer, d’analyser et de comprendre la performance de son site web e-commerce.
Le plus important des conseils que nous pouvons vous donner est de bien construire votre plan d’analyse au départ et de choisir quels indicateurs vous souhaitez observer, pour quels objectifs finaux.
Il est nécessaire de chercher les failles du plan d’analyse, et les potentielles interprétations qui pourraient ne pas être pertinentes en fonction de certains facteurs. Ce n’est qu’ainsi que vous pourrez faire confiance aux données statistiques liées à votre site et que vous pourrez vous appuyer dessus pour prendre vos décisions.
Vous avez envie de vous lancer dans le e-commerce ? Vous êtes à la recherche d’un spécialiste pour créer votre boutique en ligne ? Trouvez un développeur e-commerce freelance sur Codeur.com.